
Data Visualization Made Simple: Beginner’s Guide
Today, data visualization is everywhere.
For instance, businesses use it daily.
At the same time, students use it in school projects.
In addition, mobile apps depend heavily on it.
However, there is still a problem.
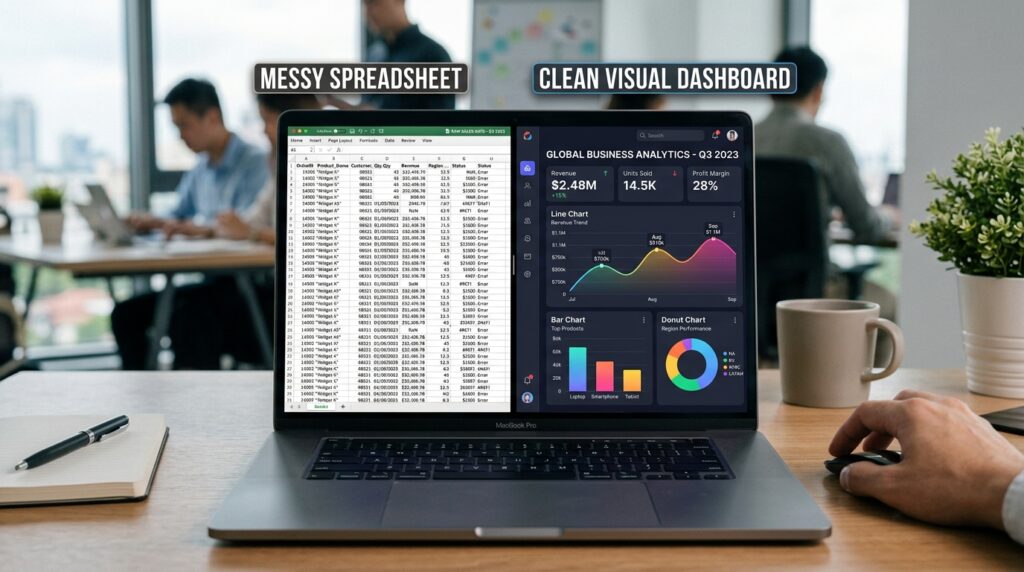
Raw numbers often feel confusing.
Sometimes, they even feel stressful to read.
After all, nobody wants to spend hours on large spreadsheets.
Because of this, visuals become very important.
For example, charts simplify complex information.
Likewise, graphs quickly reveal patterns and trends.
As a result, dashboards improve understanding in seconds.
Therefore, people make better and faster decisions.
That is exactly why data visualization matters today.
The best part is simple.
You do not need expert skills to begin.
In fact, anyone can learn step by step.
No advanced math is required. No complex coding is needed.
Instead, only practice and patience matter.
So in this guide, you will learn:
- What does data visualization mean
- Why is it important
- Common chart types
- Beginner-friendly tools
- Real-life examples
- Career benefits
- Helpful tips
Now, let’s begin.
Read more: AI and Random Forest: The Ultimate Beginner-to-Pro Guide (2026)
What Is Data Visualization?
In simple terms, data visualization means presenting data in visual form.
Instead of plain numbers, information appears as:
- Charts
- Graphs
- Maps
- Dashboards
As a result, people understand data much faster.
Think about it for a moment.
Would you prefer reading hundreds of numbers?
Or would you rather understand everything through one clear chart?
Obviously, a chart is easier.
That is the real power of data visualization.
It turns confusing data into clear insights.
Moreover, it saves a lot of time.
Read more: Jupiter Notebook: A proven Tool That Makes Coding Effortless
Why Is Data Visualization Important Today?
Today, data is growing every second.
For example, every click creates data.
Similarly, every online purchase generates data.
Even social media activity produces new information daily.
Sounds surprising, right?
However, raw data alone is not useful.
People first need clarity.
As a result, data visualization becomes essential.
For instance, visuals help people:
- Understand information quickly
- Spot trends easily
- Find patterns faster
- Reduce confusion
- Make better decisions
Without visuals, large datasets feel overwhelming.
In fact, many people lose focus when they see too many numbers.
Therefore, businesses now rely heavily on visual data.
Best Monitors for Data Visualization and Dashboards
Products:
- LG 34WR55QK-B 34-inch UltraWide WQHD (3440 x 1440) Curved Computer Monitor, 100Hz, 5ms, HDR10, Reader Mode, HDMI, DisplayPort, USB Type-C, Tilt/Height Adjustable Stand, Black
- Dell Pro 24 E2425HM 23.8″ 16:9 Full HD 100Hz IPS LED Monitor, Black
How Does Data Visualization Help Businesses?

Nowadays, businesses deal with huge amounts of data.
However, raw numbers are hard to understand.
So, companies use charts and dashboards instead.
Imagine checking thousands of sales records manually.
That would feel exhausting.
On the other hand, one simple chart can show everything.
For example, it can reveal:
- Best-selling products
- Weak sales months
- Customer behavior
- Revenue growth
All within seconds.
As a result, teams save valuable time.
More importantly, they make faster decisions.
Meanwhile, different industries already depend on visuals:
- Restaurants track orders
- Online stores monitor sales
- Marketing teams analyze campaigns
- Schools track student progress
Clearly, data visualization is now part of everyday business life.
Read more: Supervised Learning in 2026: Best Methods, Models, and Uses
Real-Life Examples of Data Visualization
Interestingly, we see data visualization almost every day.
However, most people still do not notice it clearly.
Weather Apps
For instance, weather apps often use line charts.
Because of that, temperature changes become much easier to understand.
As a result, one glance gives instant clarity.
Fitness Apps
Similarly, fitness apps also display:
- Steps
- Calories burned
- Workout progress
Usually through simple and colorful graphs.
Therefore, users stay motivated and track progress more easily.
Banking Apps
In the same way, banking apps heavily use visuals too.
For example, pie charts help users understand:
- Food spending
- Shopping expenses
- Transport costs
Consequently, users understand their spending habits better.
Social Media Apps
Meanwhile, content creators also depend on dashboards regularly.
For instance, they track:
- Followers
- Engagement
- Reach
- Performance
Otherwise, managing large amounts of data would become very difficult.
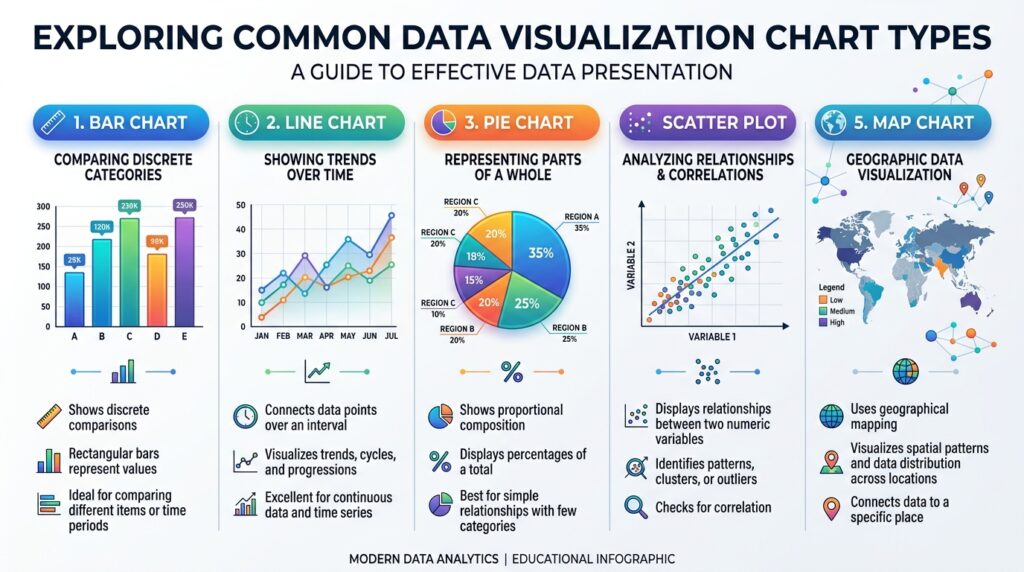
Common Types of Data Visualization Charts
Choosing the right chart is very important.
Otherwise, data may become confusing.
So, here are common types:
| Chart Type | Purpose | Example |
|---|---|---|
| Bar Chart | Compare values | Sales comparison |
| Line Chart | Show trends over time | Website traffic |
| Pie Chart | Show percentages | Budget breakdown |
| Scatter Plot | Show relationships | Research data |
| Map Chart | Show locations | Population data |
Each chart serves a different purpose.
Therefore, selection matters a lot.
Read more: Data Augmentation Made Simple for Beginners
What Are Bar Charts?
Bar charts compare different categories visually.
Luckily, they are very easy to understand.
For example, bar charts can compare:
- Product sales
- Student marks
- Website visits
In simple words, each bar represents a value.
Moreover, a taller bar usually means a higher value.
Because of this, bar charts are widely used today.
Especially in business and marketing reports.
Why Are Line Charts Useful?
Line charts show changes over time.
Therefore, they are perfect for showing trends clearly.
For instance, line charts are commonly used for:
- Monthly revenue
- Daily temperature
- Stock prices
- Website growth
Usually, an upward line shows growth.
Meanwhile, a downward line shows a decline.
As a result, people can quickly understand trends and changes.
Read more: The Ultimate Beginner’s Guide to Blackbox AI: Features, Benefits, and Comparison
When Should You Use Pie Charts?
Pie charts show parts of a whole.
Generally, they work best with smaller datasets.
For example, pie charts are useful for:
- Monthly budgets
- Survey results
- Market share
However, too many slices can create confusion.
Therefore, simple pie charts usually work better.
In most cases, fewer sections improve readability.
What Are Scatter Plots?
Scatter plots show relationships between variables.
At first, they may seem difficult.
However, they are actually quite simple.
For example, imagine comparing:
- Sleep hours
- Exam scores
In this case, each dot represents one student.
If clear patterns appear, it may show a relationship between the two variables.
Because of this, researchers and data analysts use scatter plots very often.
Is Data Visualization Important in Data Science?
Yes, absolutely.
In fact, data visualization is a major part of data science.
Before deep analysis, experts usually visualize data first.
Why?
Because visuals quickly reveal:
- Patterns
- Errors
- Trends
- Missing values
- Relationships
Without charts, large datasets often feel messy and confusing.
Moreover, visualization helps experts explain findings more clearly.
Especially to non-technical audiences.
Therefore, communication becomes much easier and more effective.
Read more: Predictive Analytics Made Simple for Modern Businesses
Best Tools for Beginners
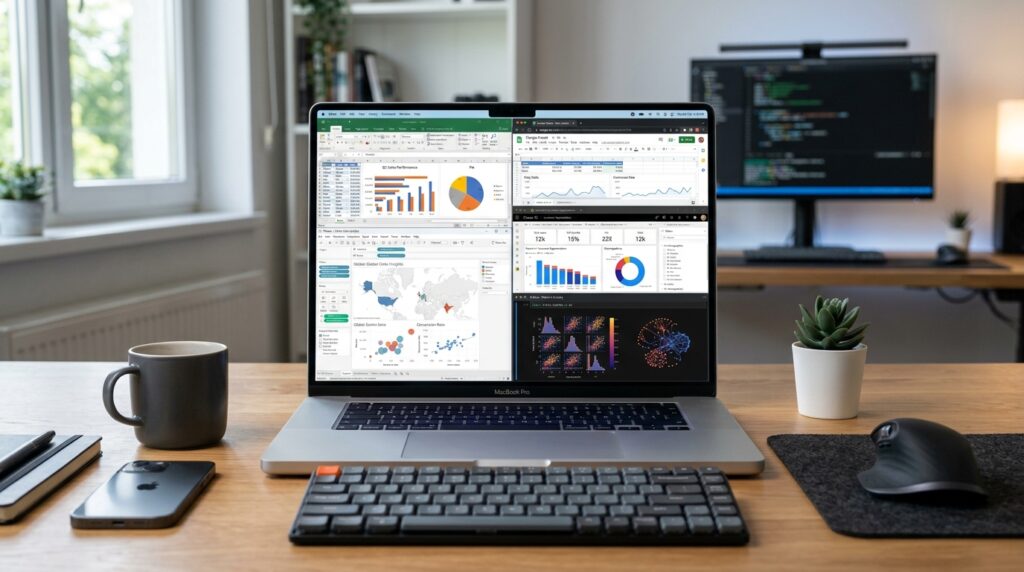
Fortunately, many easy tools exist today.
Best Laptops for Learning Data Visualization
Product Ideas:
- Apple 2022 MacBook Air Laptop with M2 chip, 13.6-inch, 8GB RAM, 512GB SSD Storage, Midnight (Renewed)
- ASUS Vivobook Go 15.6” Slim Laptop, AMD Ryzen 5 7520U, 8GB, 512GB, Windows 11 Home, Cool Silver, Military Grade Durability, Fast Charging, Webcam Shield, E1504FA-AS54
- Lenovo IdeaPad Slim 3X – 2025 – Everyday AI Laptop – Copilot+ PC – 15.3″ WUXGA Display – 16 GB Memory – 512 GB Storage – Snapdragon® X – Luna Grey
- HP Pavilion 15.6″ HD Touchscreen Anti-Glare Laptop, 16GB RAM, 1TB SSD Storage, Intel Core Processor up to 4.1GHz, Up to 11 Hours Long Battery Life, Type-C, HDMI, Windows 11 Home, Silver
Excel
First, Excel is very beginner-friendly.
Most people already know it.
It allows you to create:
- Bar charts
- Pie charts
- Line graphs
Very quickly.
Google Sheets
Similarly, Google Sheets is simple and free.
Because of that, students use it widely.
Tableau
Meanwhile, Tableau is used for dashboards.
Businesses rely on it heavily.
Power BI
Likewise, Power BI is popular in companies.
It is used for reporting and analysis.
Python Libraries
Later, you can explore Python tools:
- Matplotlib
- Seaborn
- Plotly
However, beginners should start simple first.
Read more: Supervised Learning in 2026: Best Methods, Models, and Uses
Best Practices
Good visuals are not only attractive.
More importantly, they must be clear.
So, follow these tips:
Keep it simple
Complex designs reduce clarity.
Use clear labels
Common Mistakes
People should understand instantly.
Avoid too many colors
Too many colors confuse users.
Choose the correct charts
Match the chart with the purpose.
Focus on one message
Do not overload information.
Read more: Wonbolt Is Now Accepting Guest Posts in Cybersecurity – Submit Yours
Beginners often make mistakes.
However, these are easy to fix.
| Mistake | Solution |
|---|---|
| Too many colors | Keep it simple |
| Too much data | Focus on key points |
| Wrong chart choice | Match purpose |
| Small labels | Use readable text |
| Overdesign | Keep it clean |
Small improvements make a big difference.
Final Thoughts on Data Visualization
At first, data visualization may feel difficult.
However, over time, it becomes much easier with practice.
Gradually, step by step, your understanding improves.
So, remember a few important things:
Firstly, start simple.
Secondly, practice regularly.
Moreover, focus on clarity in every chart you make.
Eventually, your skills will improve naturally.
Most importantly, keep learning consistently.
Because, in the end, people who explain data clearly always stand out.
Read more: AI and Random Forest: The Ultimate Beginner-to-Pro Guide (2026)
FAQs About Data Visualization
What is data visualization?
Basically, it is a way to show data using charts and graphs.
Why is data visualization important?
In fact, it helps people understand data quickly and easily.
Do I need coding for data visualization?
Actually, no. Many tools work without coding.
What are common tools for beginners?
For example, Excel and Google Sheets are best for beginners.
Is data visualization hard to learn?
No, it is not hard. Instead, it is easy with practice and simple tools.
Where is data visualization used?
Generally, it is used in business, education, and apps.
Can beginners learn it fast?
Yes, definitely. Beginners can learn basic skills quickly.
Read more: Data Augmentation Made Simple for Beginners
Call To Action
Need SEO content that ranks on Google and keeps readers engaged?
I create:
- SEO blog posts
- Keyword-focused articles
- Human-style content
- Easy-to-read blogs
- High-engagement website content
Let’s build content that performs.
📧 Email: craziya167@gmail.com
📱 WhatsApp: +92 371 4778412
Author Bio:
Raziya is an SEO content writer specializing in AI, technology, and digital marketing. Her goal is to create clear, engaging, and easy-to-understand content for online readers.


Post Comment
You must be logged in to post a comment.